jessiemar-portfolio
| home page | data viz examples | critique by design | final project I | final project II | final project III |
Important note: this template includes major elements of Part I, but the instructions on Canvas are the authoritative source. Make sure to read through the assignment page and review the rubric to confirm you have everything you need before submitting. When done, delete these instructions before submitting.
Outline
Include a high-level summary of your project. This should be a couple paragraphs that describe what you’re interested in showing with your final project.
My project will explore how museums can successfully manage their exhibition departments while establishing digital collection platforms, particularly in response to rising digital engagement. Exhibitions are often the driving force of museums — shaping audience experience, educational outreach, and revenue generation. Yet, sustaining them requires robust funding and efficient management.
In addition, major museums are increasingly investing in digital collections to expand access, allowing the public to engage with artworks online for research, education, and pre-visit planning. This digital expansion, however, depends on increased awareness and financial support from donors and stakeholders.
Through this project, I aim to highlight the importance of exhibitions and digital collections as essential components of museum sustainability. I will use data on audience participation, museum contributions to the economy, exhibition costs within museum budgets, and survey responses to digital collections. By presenting these insights, I hope to show why increased investment in exhibition departments and digital infrastructure is necessary for the future of museums.
A project structure that outlines the major elements of your story. Your Good Charts text talks about story structure in Chapter 8 - you should describe what you hope to achieve. Make sure the outline is detailed enough that we can see how you anticipate your story unfolding. You can incorporate your Story Arc from the in-class exercise along with your user stories and one sentence summary to make the topic even more clear.
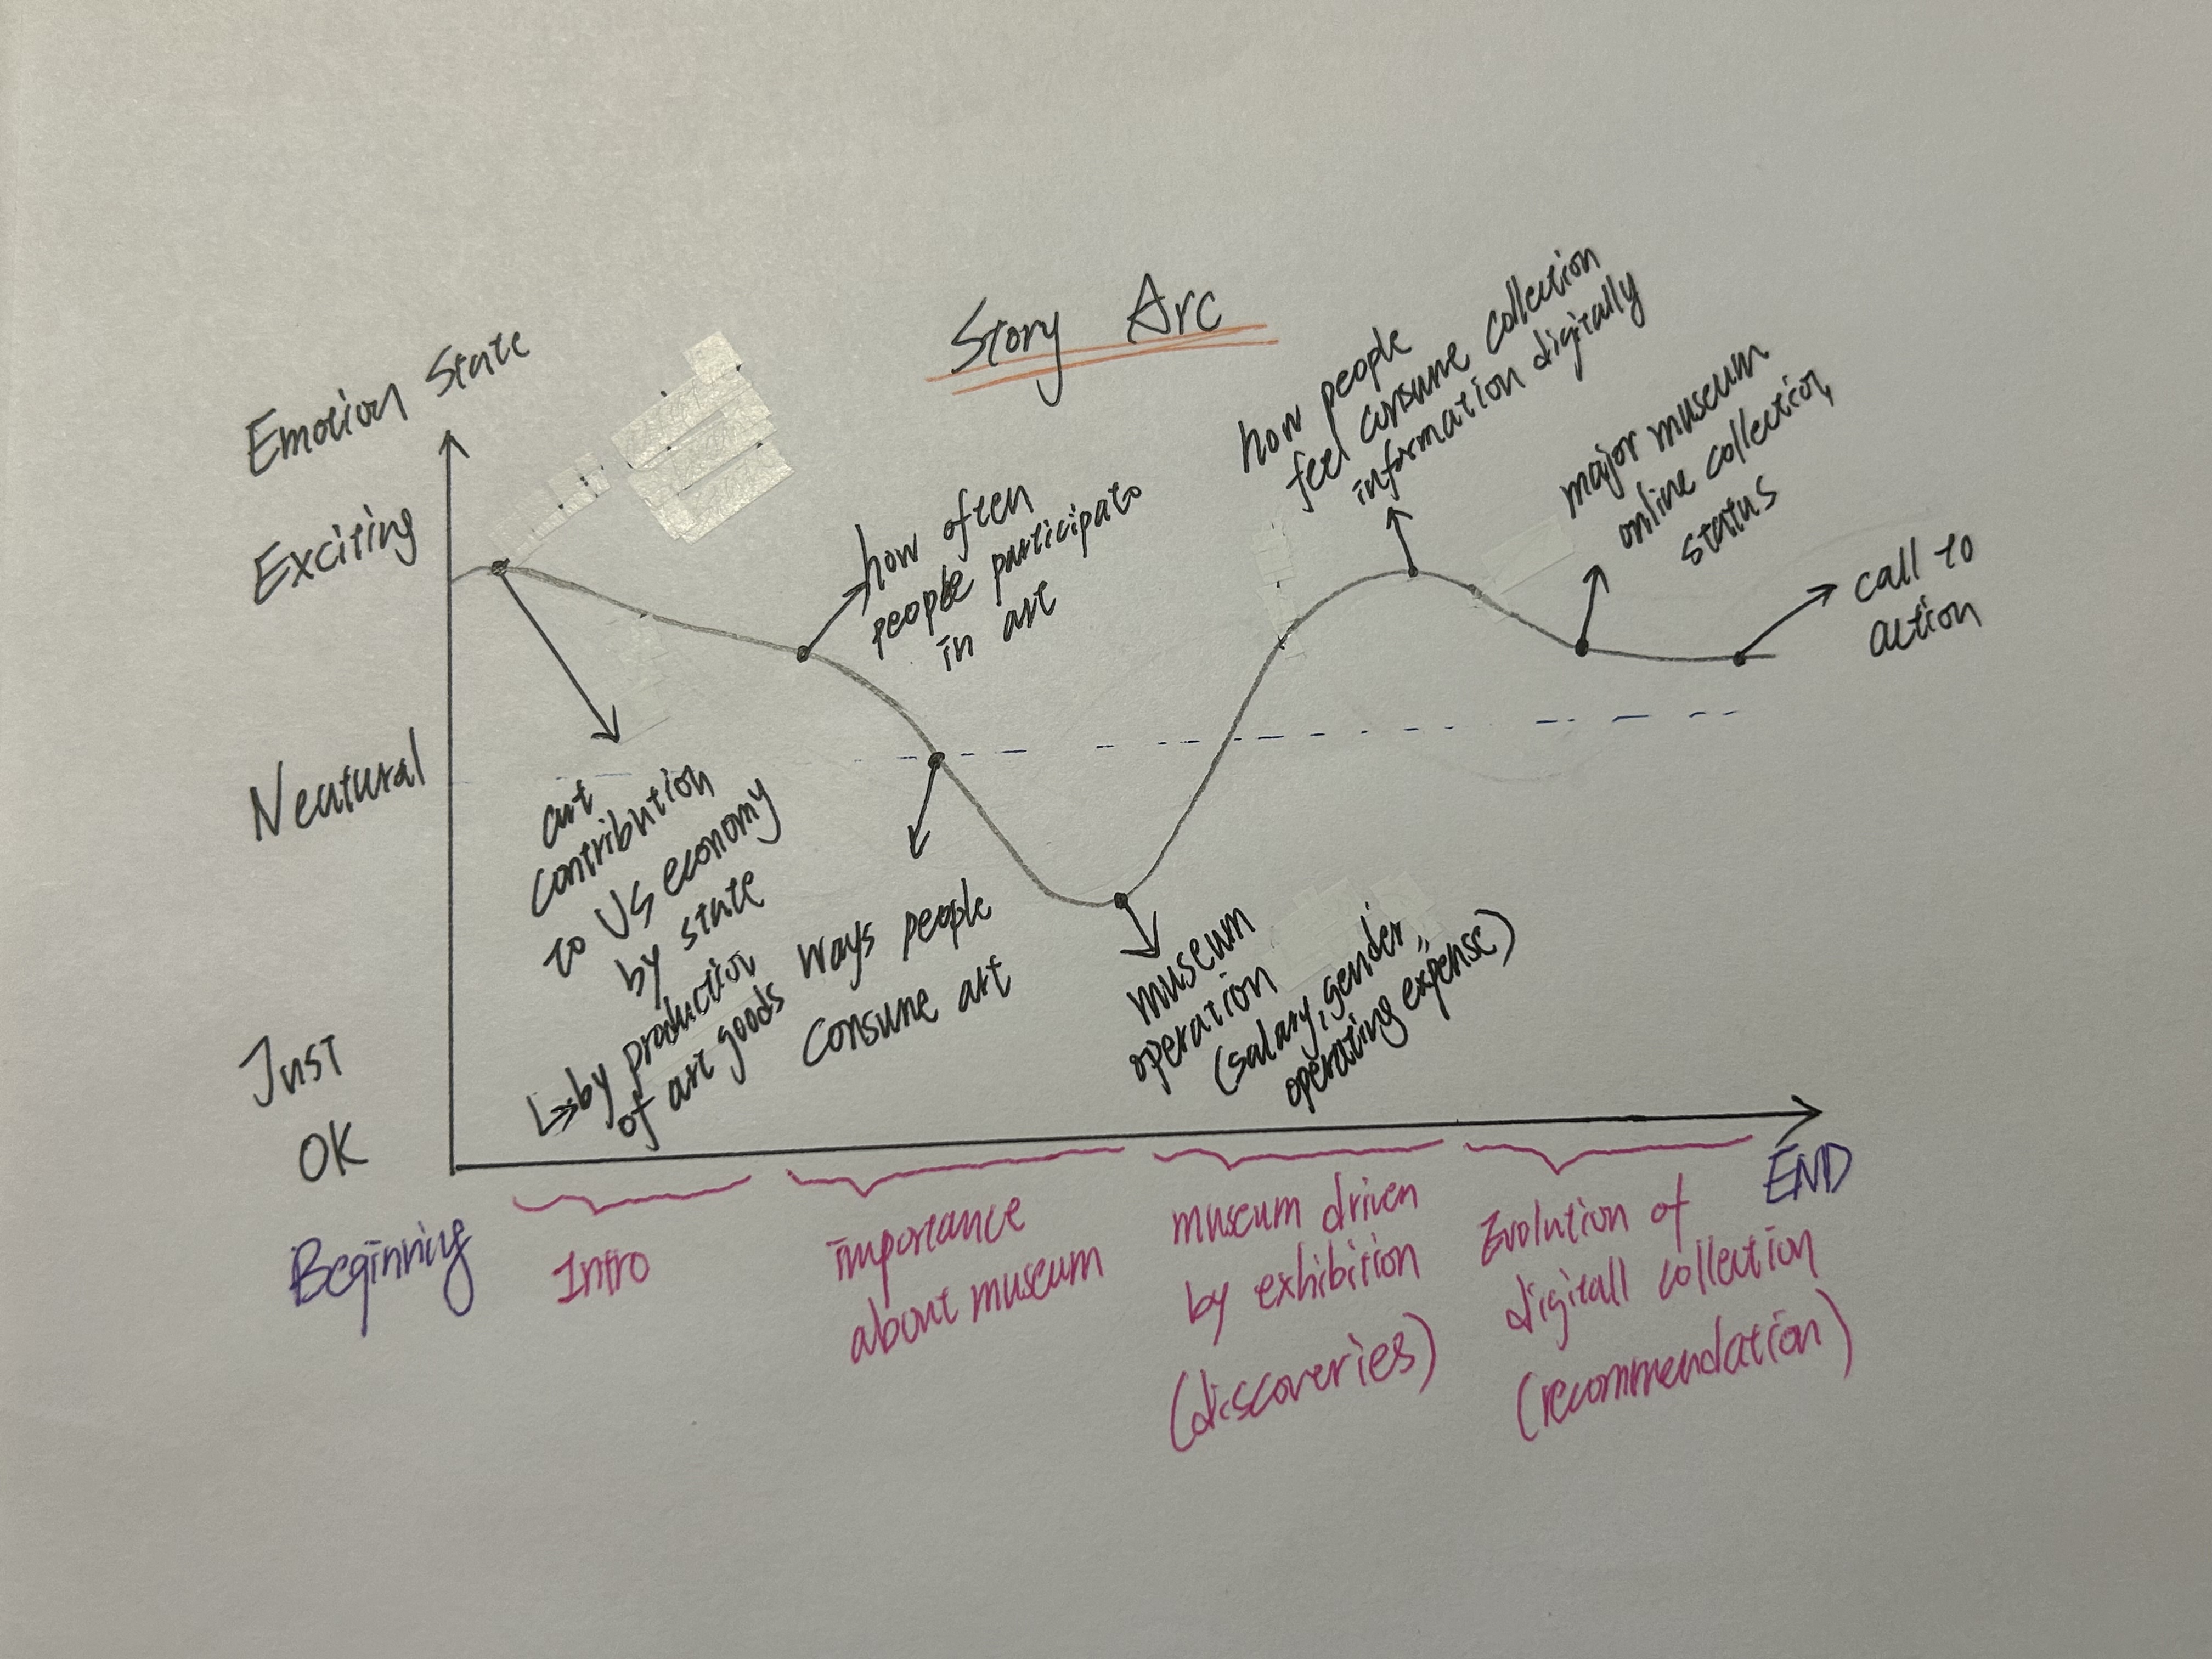
Project Structure
1. Beginning – Arts and Museums as Economic and Cultural Drivers
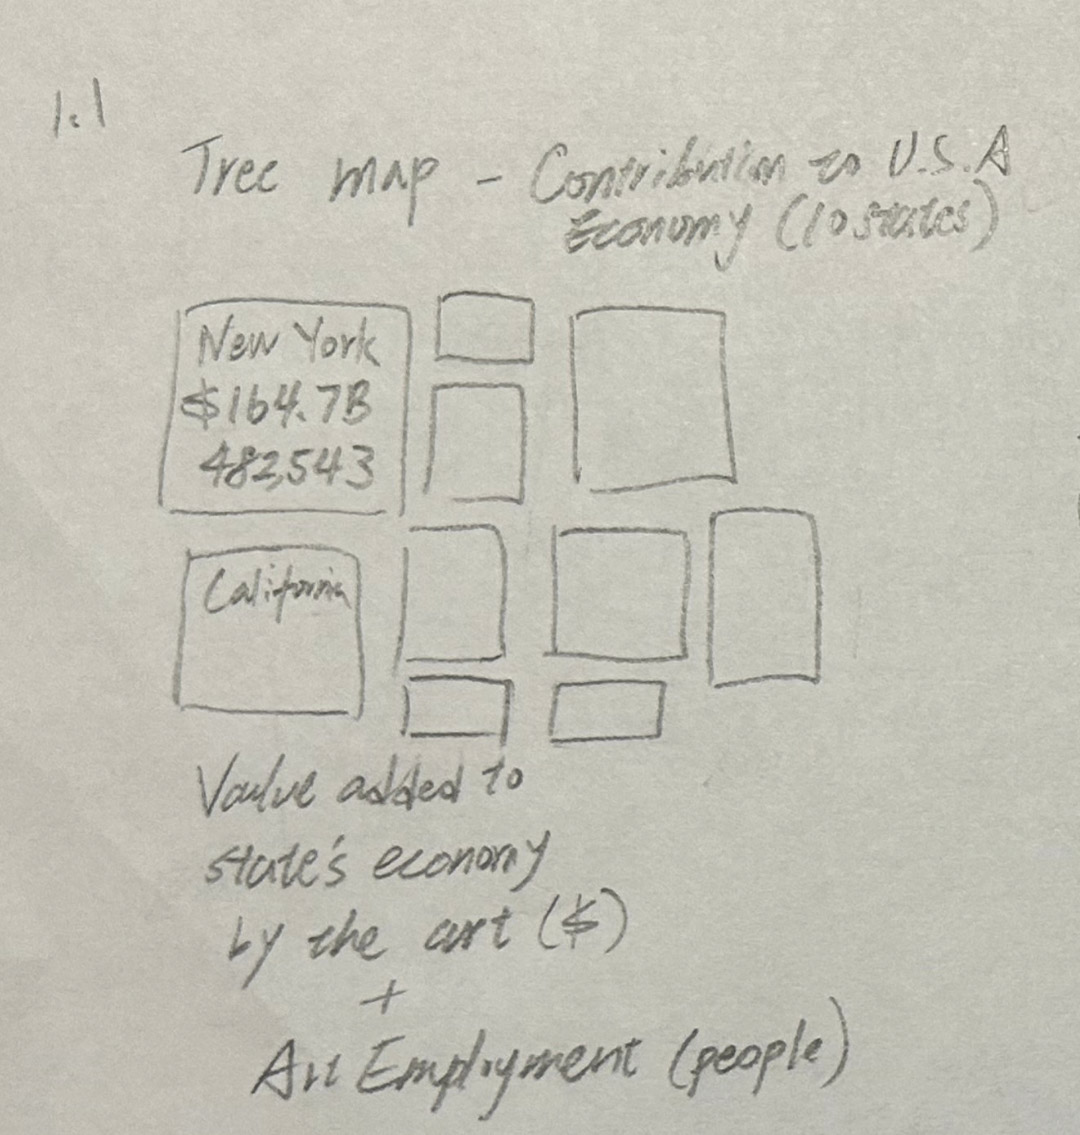
- State-Level Estimates of the Arts’ Economic Value and Employment (2001–2023): Value added to each state’s economy by the arts.
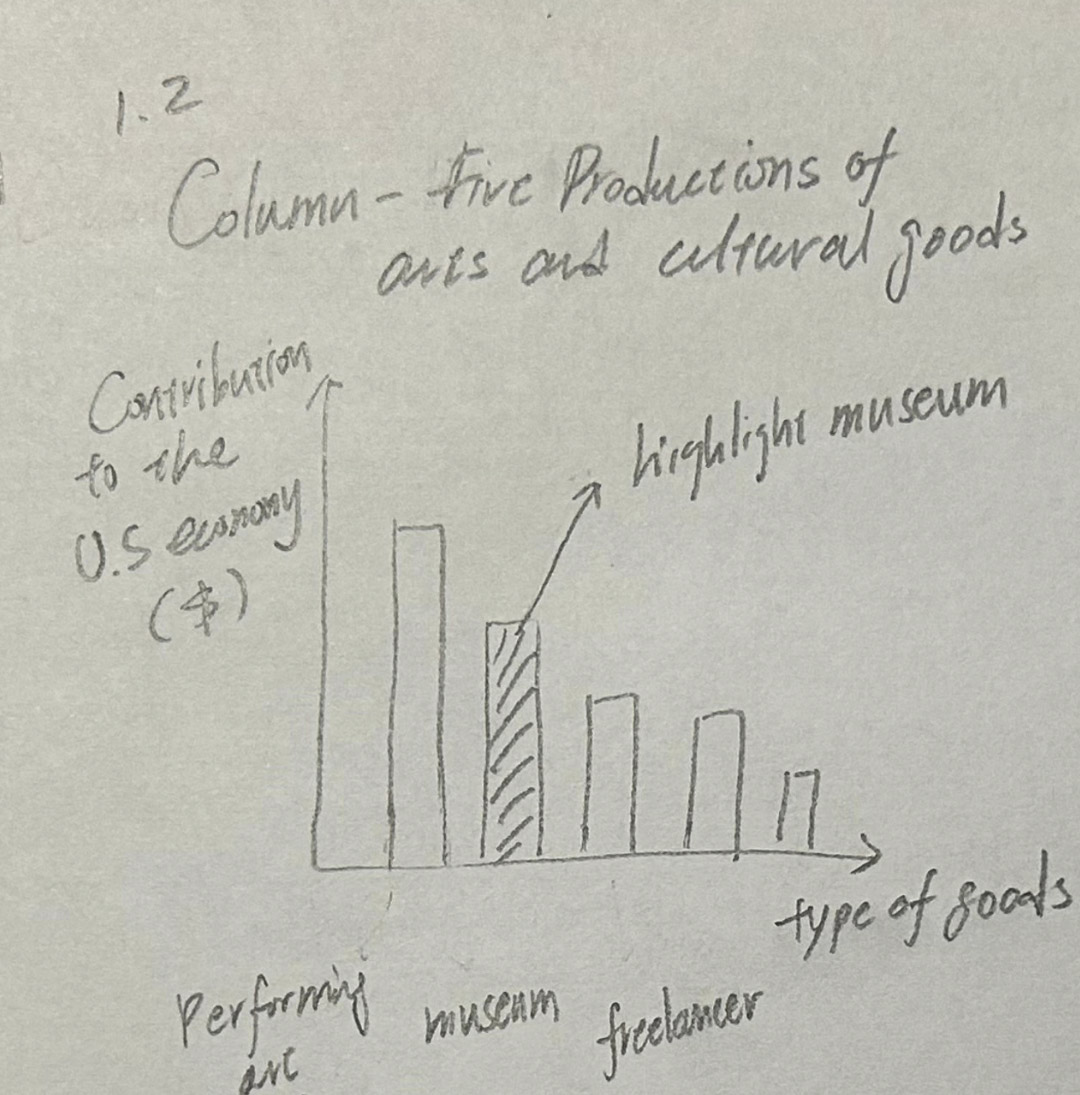
- U.S. Arts and Cultural Production Satellite Account: Type of production of arts and cultural goods and their contribution to the U.S. economy and annual growth.
- Framing Point: Arts and culture are not just leisure activities — they are major contributors to the economy and employment, making museums vital players in this ecosystem.
2. Importance of Museums – Public Participation and Engagement
- 2020 Arts Basic Survey: Forms of arts participation (Attend or Visit Art vs. Use a Device to Access Art). Selected from Top 10 states based on SMU DataArts Arts Vibry ranking in 2024.
- Framing Point: Museums are a key touchpoint for cultural participation, proving their relevance to both local and national audiences.
3. Exhibitions as the Core of Museums
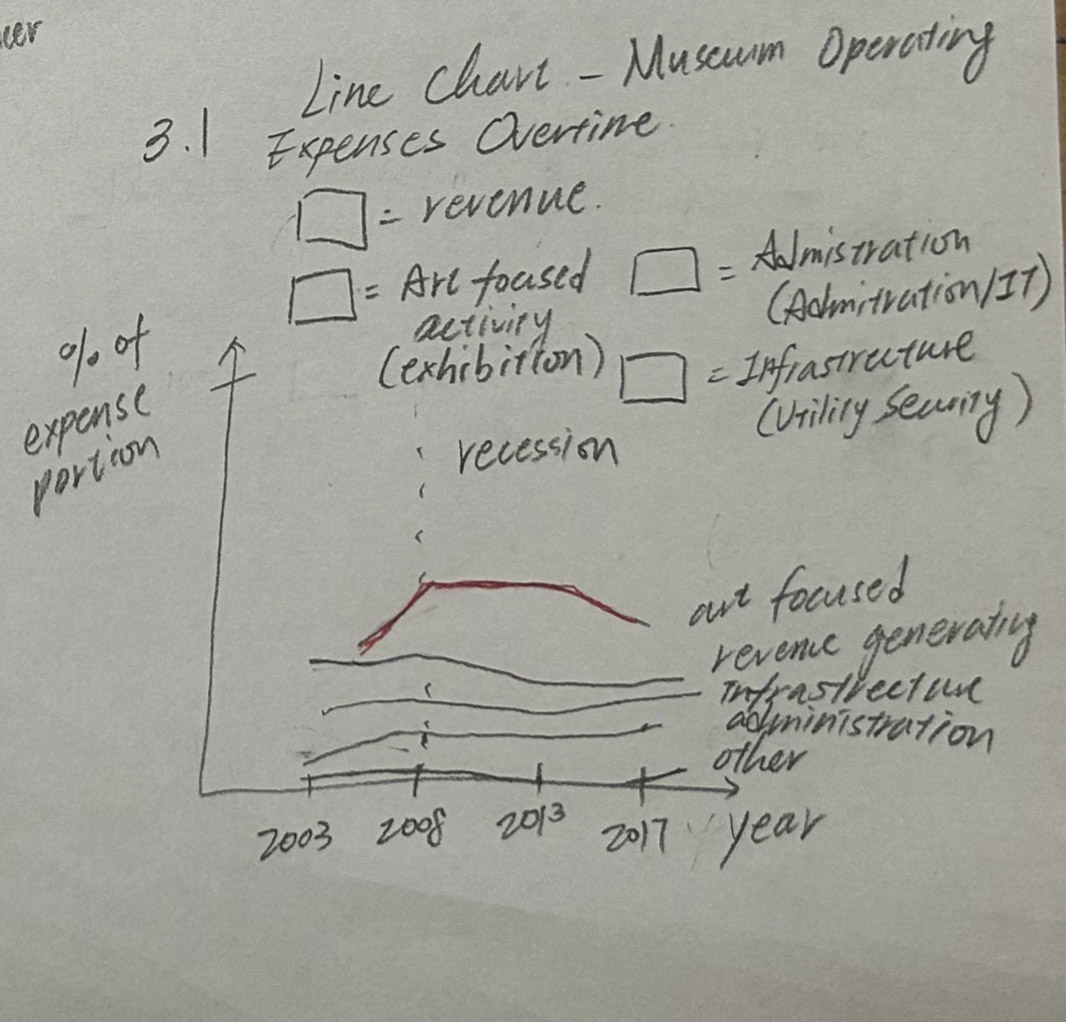
- Art Museums by the Numbers 2018 (AAMD): Museum operating budgets highlight exhibitions as a central function, representing the largest proportion of overall expenses.
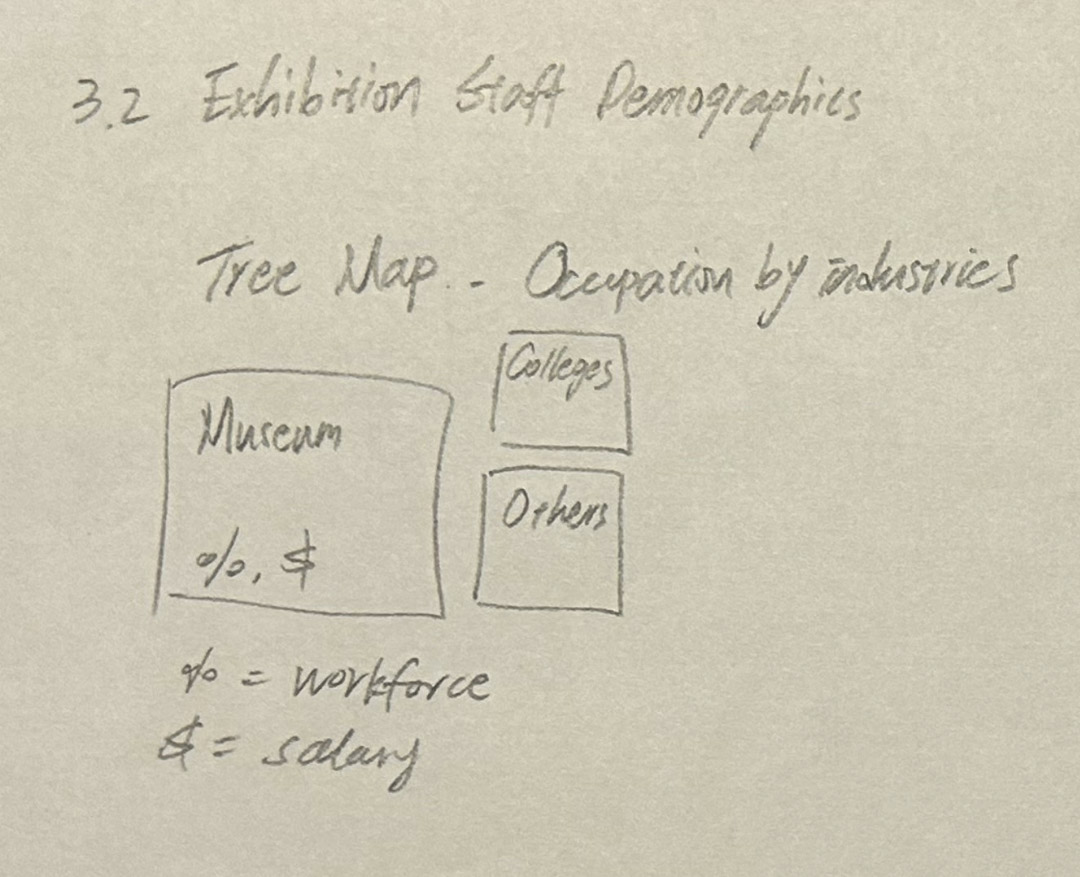
- Occupations & Staffing (DataUSA): Occupations by industries, salaries, major, education levels in archivists, curators, and museum technicians.
- Framing Point: Exhibitions are resource-intensive, driving staffing needs and budgets, and thus must remain a priority in museum planning and funding.
4. Evolution of Digital Collections – Expanding Access and Expectations
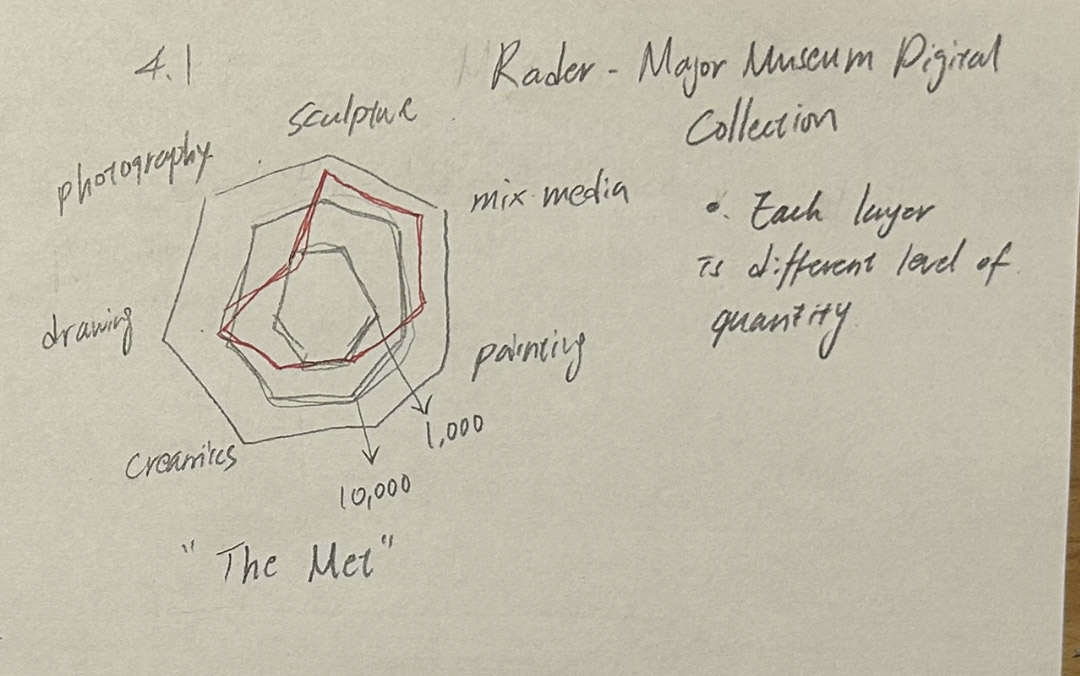
- Major Museum Digital Collections: Data from leading museums with open access — MoMA, The Met, National Gallery of Art, and the Cleveland Museum of Art — consolidating the number of artworks online by category, average year, and artistic genre.
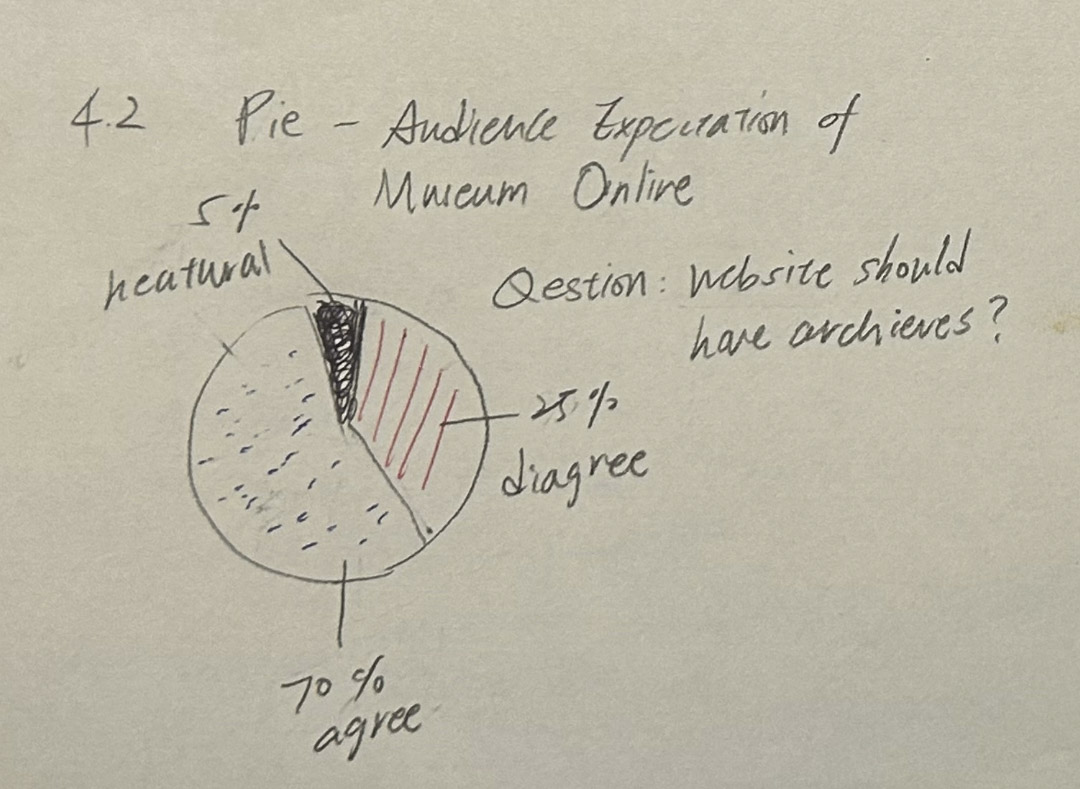
- Audience Expectations of Museums Online: Public attitudes toward digital access and museum websites. Framing Point: Digital collections are increasingly viewed as core infrastructure for museums, expanding access beyond physical visitors.
5. Conclusion – Why Funding and Awareness Matter
Synthesis:
- Arts = Major economic and cultural sector
- Museums = Participation hubs
- Exhibitions = Operational core
- Digital collections = Further accessibility
Call to Action: To maintain relevance and accessibility, museums must secure funding and raise awareness for both exhibitions and digital infrastructure. Stakeholders — including philanthropists, donors, and newly established museums — should view these areas as investments in education, research, and long-term audience engagement.
Initial sketches
Post images of your anticipated data visualizations (sketches are fine). They should mimic aspects of your outline, and include elements of your story.
State-Level Estimates of the Arts’ Economic Value and Employment (2001–2023)
U.S. Arts and Cultural Production Satellite Account
2020 Arts Basic Survey

Art Museums by the Numbers 2018 (AAMD)
Occupations & Staffing (DataUSA)
Major Museum Digital Collections
Audience Expectations of Museums Online
The data
A couple of paragraphs that document your data source(s), and an explanation of how you plan on using your data.
For this project, I will draw from a combination of federal surveys, museum field reports, and institutional open-access datasets. These sources provide economic, participation, and collection-level data that will allow me to analyze how exhibitions and digital collections contribute to the sustainability of museums.
The first group of datasets comes from the National Endowment for the Arts (NEA) and the Bureau of Economic Analysis (BEA). The State-Level Estimates of the Arts’ Economic Value and Employment (2001–2023) and the U.S. Arts and Cultural Production Satellite Account detail the arts’ value-added contributions to state and national GDP, annual growth, compensation, and employment. I will use these data to establish the broader context of the arts as a key economic driver. In addition, the Arts Basic Survey (2020) and state-level participation reports (focusing on the top 10 states with the highest levels of art vibrancy from SMU DataArts) provide estimates of how Americans engage with the arts, including live attendance at museums and other events. These sources will demonstrate the importance of museums as central sites of cultural participation.
The second group of datasets comes from museum field-specific sources. The Art Museums by the Numbers 2018 report by the Association of Art Museum Directors (AAMD) provides insights into museum operating expenses, staffing distribution, and collection growth, with exhibitions highlighted as a major share of budgets. To build on this, I will use DataUSA profiles for museums and for archivists, curators, and museum technicians, which include workforce size, salaries, and educational backgrounds. These sources will illustrate how museum exhibitions require significant staff and resources, and why they represent a central budgetary concern.
The final group of datasets focuses on digital collections. Open-access collection data from institutions such as MoMA, The Met, the National Gallery of Art, and the Cleveland Museum of Art provide information on digitized artworks, categorized by type, year, and genre. Additionally, survey data on Attitudes and Expectations Concerning Museums and Museum Websites (pp. 89–90) will highlight how visitors—particularly younger demographics—rely on digital platforms. Together, these sources will show how digital collections have become a core component of museum engagement and why investment in these platforms is essential.
A link to the publicly-accessible datasets you plan on using, or a link to a copy of the data you’ve uploaded to your Github repository, Box account or other publicly-accessible location. Using a datasource that is already publicly accessible is highly encouraged. If you anticipate using a data source other than something that would be publicly available please talk to me first.
| Name | URL | Description |
|---|---|---|
| U.S. Arts and Cultural Production Satellite Account (NEA/BEA) | https://www.arts.gov/impact/research/arts-data-profile-series/adp-36 | National data on production of arts & cultural goods and their contribution to GDP, employment, and average annual growth. |
| State-Level Estimates of the Arts’ Economic Value and Employment (NEA/BEA) | https://www.arts.gov/impact/research/arts-data-profile-series/37 | State-level arts value-added, workers’ compensation, and employment (2001–2023). |
| Arts Basic Survey 2020 (NEA) | https://www.arts.gov/impact/research/arts-data-profile-series/adp-32 | National survey on arts participation, including attendance at live events and personal art-making. |
| 10 States Study (SMU DataArts) | https://smu.app.box.com/s/xy5isghxhfc20ac8uclh0qe46tfpgnyz/file/1717104448334 | State-level estimates of arts participation patterns across selected U.S. states. |
| Art Museums by the Numbers 2018 (AAMD) | https://aamd.org/our-members/from-the-field/art-museums-by-the-numbers-2018 | Field report on museum operations, budgets, staffing, attendance, and collection growth (with emphasis on exhibitions). |
| DataUSA — Archivists, Curators, Museum Technicians | https://datausa.io/profile/soc/archivists-curators-museum-technicians?majors-select=commonMajors°ree-majors=bachelorsDegree | Workforce data for museum professions: occupations, salaries, degree backgrounds, and employment distribution. |
| Attitudes and Expectations Concerning Museums and Museum Websites | https://marty.cci.fsu.edu/preprints/marty_mmc2008.pdf?utm_source=chatgpt.com | Survey on visitor perceptions and expectations of museum websites and digital access. |
| Cleveland Museum of Art — Open Access API | https://github.com/ClevelandMuseumArt/openaccess | Open-access collection data and images; artwork metadata by type, year, and genre. |
| Museum of Modern Art (MoMA) — Collection Dataset | https://github.com/MuseumofModernArt/collection?utm_source=chatgpt.com | Open dataset of MoMA’s collection with artist/artwork metadata and digital availability. |
| The Met — Open Access API | https://github.com/metmuseum/openaccess | Open-access dataset and images for The Met collection across departments. |
| Art Institute of Chicago — Data Service | https://github.com/art-institute-of-chicago?utf8=%E2%9C%93&q=data-service&type=&language= | Open API endpoints for AIC collection data (objects, images, metadata). |
| National Gallery of Art — Open Data | https://github.com/NationalGalleryOfArt/opendata) | Public open-data repository for NGA collection metadata and digitized works. |
Method and medium
In a few sentences, you should document how you plan on completing your final project.
For my final project, I plan to use Shorthand, Datawrapper, and Tableau as my primary tools. Before beginning the fabrication of data visualizations, I will develop a moodboard to establish the branding and visual direction of the project. This will guide my creative choices and ensure a consistent style throughout. I also intend to create a persona to help tailor headlines and subheadlines in language that resonates with my target audience.
For data preparation, I will first use Excel for cleaning and consolidating datasets, particularly the large-scale open-access digital collection data from museums. Once I have organized clean sheets of data, I will implement them in Datawrapper and Tableau to design interactive, engaging visualizations. These will then be integrated into Shorthand to build a cohesive, narrative-driven final deliverable.
References
List any references you used here.
AI acknowledgements
I used AI to support this assignment by helping me research relevant data sources and proofread grammar and spelling in my writing.